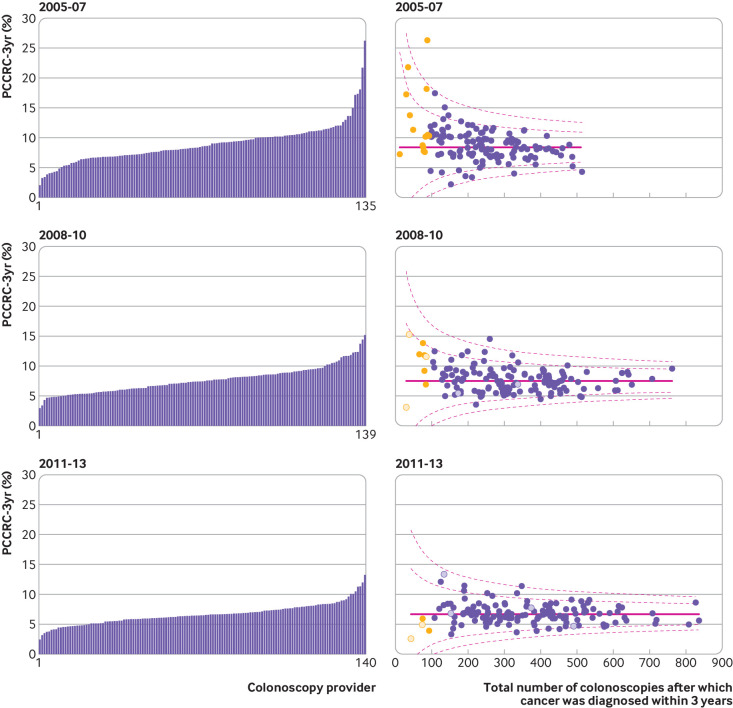
Fig 3.
Adjusted variation in rates of post-colonoscopy colorectal cancer within three years of investigation (PCCRC-3yr) by provider for 2005-07, 2008-10, and 2011-13. In funnel plots each dot represents an individual colonoscopy provider. Dashed lines represent 95% and 99.8% control limits outside national PCCRC-3yr rate (solid line). X axis is number of detected cancers plus PCCRC-3yr cancers diagnosed in the period. Adjusted for non-modifiable risk factors: year of colonoscopy, age group at colonoscopy, sex, index of multiple deprivation income category (fifths), comorbidity score, previous Hospital Episode Statistics coded diagnosis of inflammatory bowel disease or diverticular disease, previous colorectal cancer, previous colonoscopy, and whether the colonoscopy was within English NHS bowel cancer screening programme or by independent provider. Yellow dots indicate providers who diagnosed less than 96 cancers in the given period. Hollow dots represent independent colonoscopy providers

