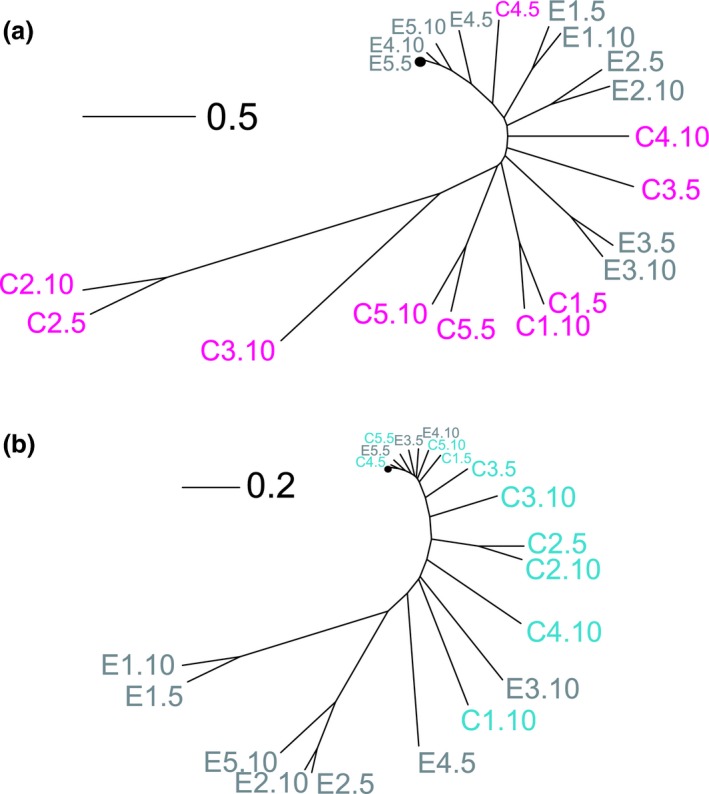
Figure 5.

Genetic distances of pathogen and defensive microbe populations. (a) Phylogenetic tree for Staphylococcus aureus populations from the single evolution treatment (E1–5 in grey) and co‐evolution treatment (C1‐5 in magenta) from passages 5 and 10 along with the ancestor (black circle). (b) Phylogenetic tree for Enterococcus faecalis populations from the single evolution treatment (E1–5 in grey) and co‐evolution treatment (C1‐5 in turquoise) from passages 5 and 10 along with the ancestor (black circle). Genetic distances based on Euclidean distances calculated from the frequency and identity of mutations in each population. Scale bar indicates Euclidean distance.
