Figure 1.

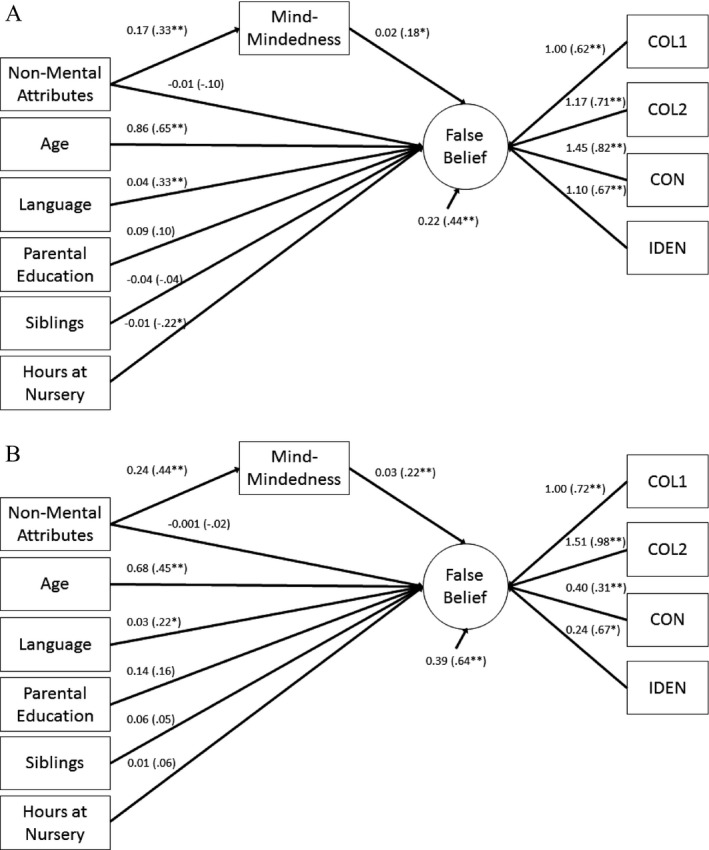
Predictors of individual differences in false belief understanding in the United Kingdom (A) and Hong Kong (B) samples.Note. *p < .05. **p < .01. Paths depict unstandardized estimates. Standardized estimates are shown in parentheses.

Predictors of individual differences in false belief understanding in the United Kingdom (A) and Hong Kong (B) samples.Note. *p < .05. **p < .01. Paths depict unstandardized estimates. Standardized estimates are shown in parentheses.