
Figure 2.
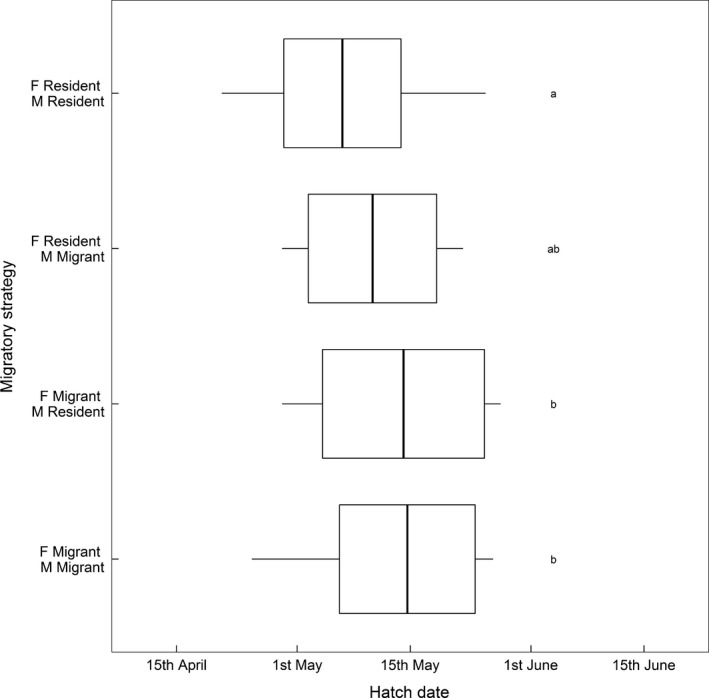
Distributions of hatch dates of breeding attempts made by shag pairs where both the male (M) and female (F) were classified as resident or migrant. Thick bars and boxes show raw mean breeding success ±1 standard deviation, and whiskers demarcate the full range. Lowercase letters indicate significantly different modelled groups