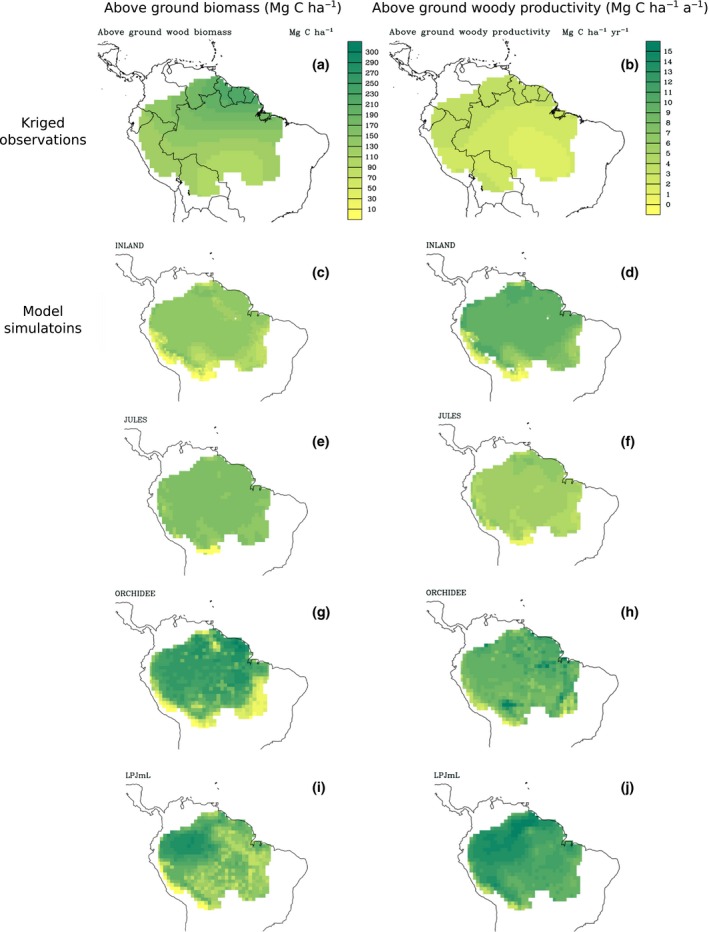
Figure 5.

Kriged maps of above‐ground biomass and woody productivity from RAINFOR forest plot observations and simulated mean above‐ground biomass and woody NPP for 2000–2008 for four DGVMs. All maps are presented on the same scale; Fig. S7 displays kriged maps of the observations on independent scales. NPP, net primary productivity; DGVMs, dynamic global vegetation models.
