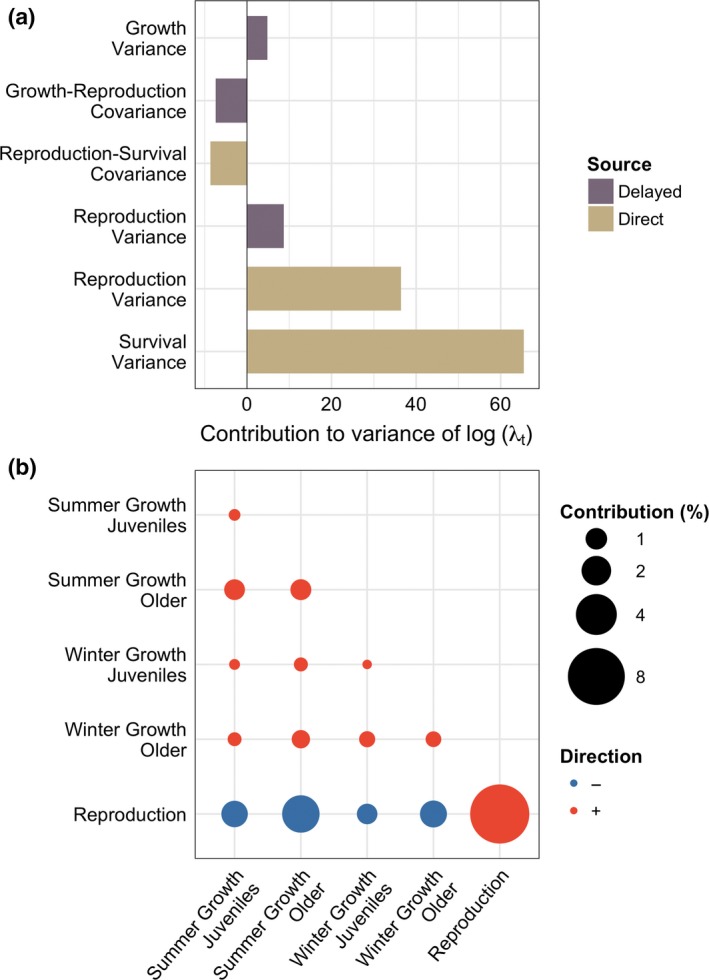
Figure 2.

The contributions of the variance and (co)variances of the vital rates to the variance of the population growth rate, log(λt). (a) The contribution is partitioned according to the direct (vital rate parameters, θit), and the delayed effects (‘lag 1’ vital rate parameters, θi(t−1)). Each bar indicates the scaled contribution (percentage of total variance of log(λt)) from each parameter on the predicted value of λt. (b) Covariation between vital rate parameters and its contribution to the predicted value of λt. The colour of the dots illustrates the directionality of the covariation.
