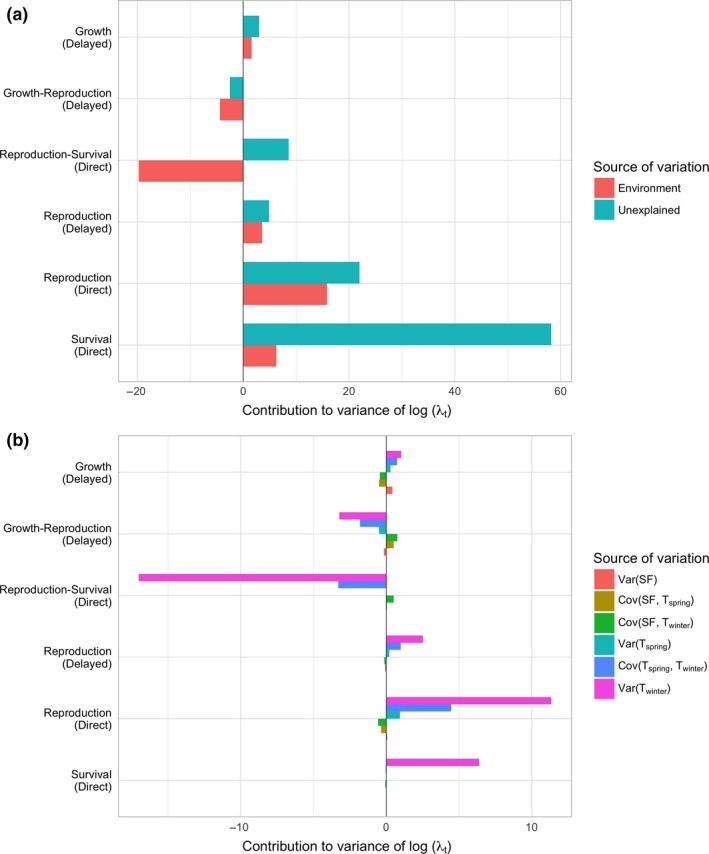
Figure 3.

The contributions from the environmental and stochastic (unexplained) variation to the variance of the population growth rate, λt. (a) Each bar indicates the contribution (percentage) from the six largest demographic contributors to the variance of log(λt) decomposed into explained (environmental) and unexplained (stochastic) sources; and (b) Each bar indicates the contribution from each parameter on the predicted variance of log(λt) decomposed into the contributions each of the environmental factors modelled.
