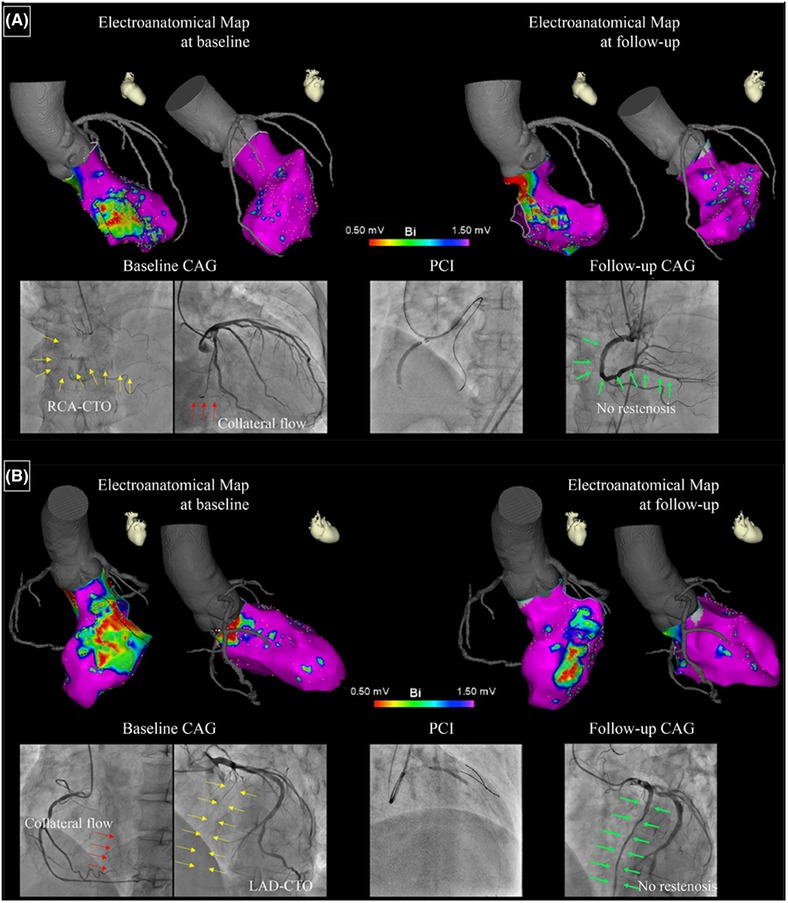
Figure 2.

Panels A and B show examples of voltage maps and coronary angiograms at baseline and follow‐up in two patients. In the voltage maps, the preserved voltage region (>1.5 mV) is purple and the dense scar region (<0.5 mV) is red. The border zone (0.5–1.5 mV) is primarily shown as blue to orange.
On baseline angiograms, the culprit CTO is indicated by a yellow arrow and the collateral is shown by a red arrow. On follow‐up angiograms, the green arrow indicates successful recanalization of the CTO. CAG = coronary angiography; CTO = chronic total occlusion; LAD = left anterior descending artery; PCI = percutaneous coronary intervention; RCA = right coronary artery [Color figure can be viewed at http://wileyonlinelibrary.com]
