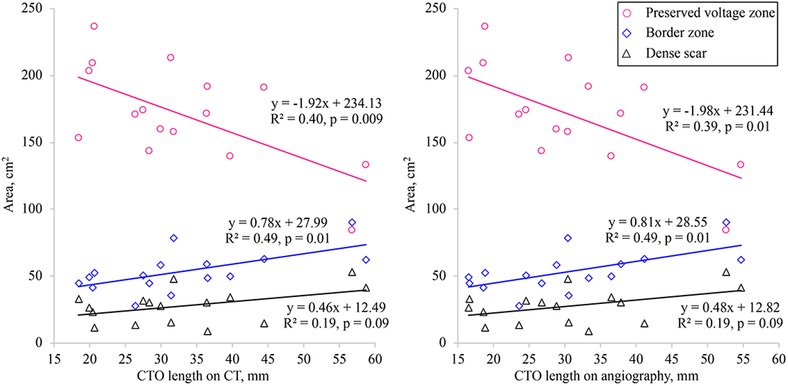
Figure 3.

Correlation between the percent surface area of each voltage region and the CTO length measured by CT (left panel) or by coronary angiography (right panel). The percent area of the border zone showed a significant positive correlation with CTO length, while the percent area of the preserved voltage region had a significant negative correlation with CTO length. However, there was no significant correlation between the percent area of the dense scar region and CTO length. CT = computed tomography; CTO = chronic total occlusion [Color figure can be viewed at http://wileyonlinelibrary.com]
