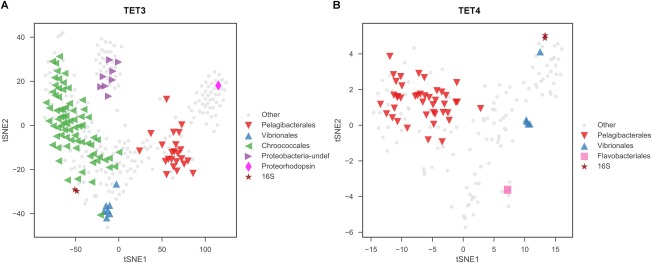
Figure 4.

t‐SNE embeddings of the 4‐mer signatures of assembled mini‐metagenomic contigs.
Plots represent samples TET3 (A) and TET4 (B), and only those contigs longer than 1000 bp were considered. Contigs were colored and shaped based on taxonomic annotations listed in Table 1. This result suggests that Pelagibacterales (including Proteobacteria‐undef) and Chroococcales were dominant in sample TET3, while Pelagibacterales was dominant in sample TET4. [Colour figure can be viewed at http://wileyonlinelibrary.com]
