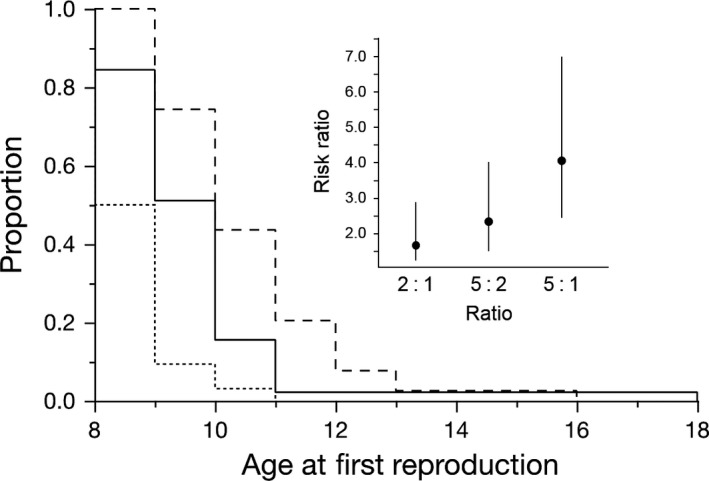
Figure 3.

Step series graph of the effects of age on time to age at first reproduction (G1 generation). Dotted line represents the oldest age group (clutch 5), solid line represents the middle age group (clutch 2), and the dashed line represents the youngest group (from clutch 1).
