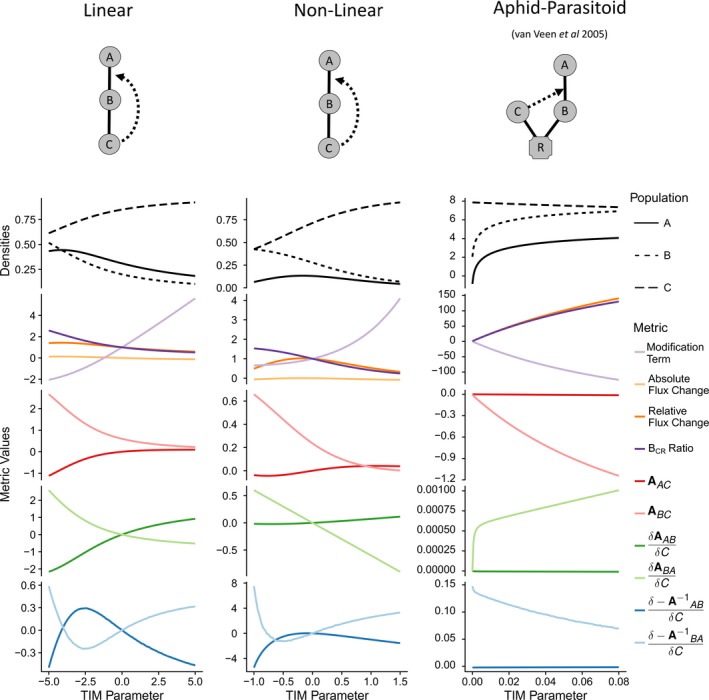
Figure 4.

Demonstration that trophic interaction modifications (TIM) metrics display different qualitative and quantitative responses to changing the underlying parameter representing the TIM strength. Full model structures and parameters are given in supporting information. Note that the aphid‐parasitoid system population densities are on a log‐scale.
