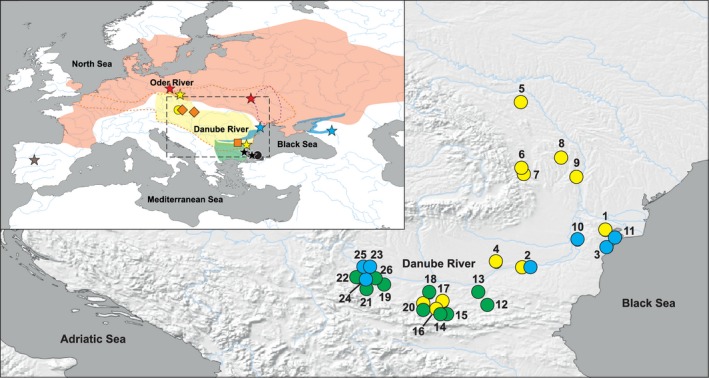
Figure 1.

Map of sampling sites and distribution of species and hybrid biotypes. The inset shows the European distribution of the sexual species studied. Red stands for the Cobitis taenia distribution range, yellow for C. elongatoides, blue for C. tanaitica, black for C. pontica and green for C. strumicae. The orange dotted line delimits the distribution of the ancient clonal lineage, the so‐called hybrid clade I, the purple dotted line the distribution of the so‐called hybrid clade II. Stars indicate sampling sites of individuals used for exome‐capture analyses (the C. paludica outgroup is in brown), circles, squares and diamonds those used in crossing experiments (circles indicate sampled sexual species, the orange square stands for diploid and diamonds for triploid C. elongatoides–tanaitica hybrids used in crossings). The main map shows in detail the Lower Danubian hybrid zone: yellow circles indicate localities with C. elongatoides, blue represents C. tanaitica, and green indicates C. strumicae. Locality numbers correspond to Table S1
