
Figure 2.
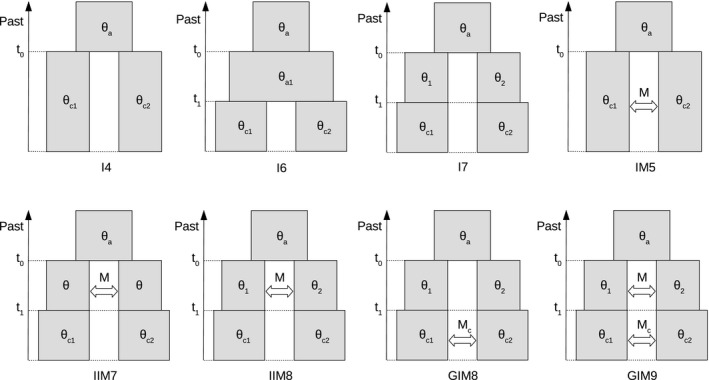
Schematic view of the eight coalescent models. Arrows along the side of model diagrams indicate the respective time periods. The population size parameter is defined as Ɵi = 4N iμ, where N i is the effective diploid size of species i and μ is the mutation rate per sequence per generation, averaged over the loci included in the analysis; the migration rate is defined as M = 4Nm, where m is the proportion of migrants per generation. Wherever an index “c” accompanies the parameter name, it will always indicate the values relevant for current populations, while an index “a” indicates the states of ancestral populations before the split