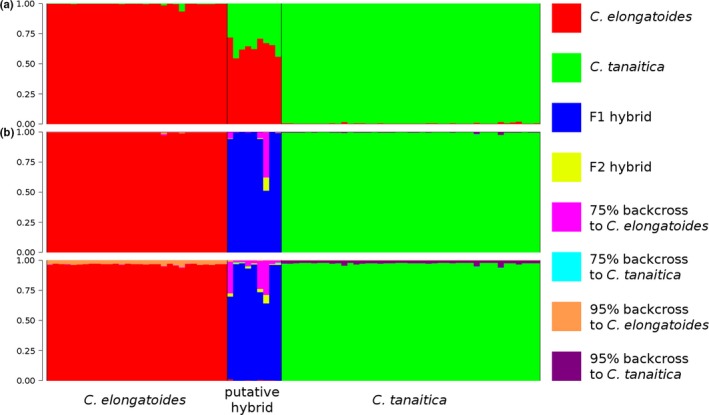
Figure 4.

Population genetic analyses of the hybrid zone. (a) Individual proportion of membership to one of the two species‐specific clusters according to structure for K = 2. Each vertical bar represents one individual, and colours show the proportion of their assignment to the respective clusters corresponding to sexual species. For visual guidance, the individuals are grouped into a priori defined biotypes according to diagnostic allozyme markers (horizontal axis). (b) Classification of individuals' genotype according to NewHybrids. Each vertical bar represents one individual. Each colour represents the posterior probability of an individual belonging to one of the eight different genotypic classes. Individuals are sorted as in (a). The upper pane represents the results with Jeffreys prior and the lower pane with the uniform prior
