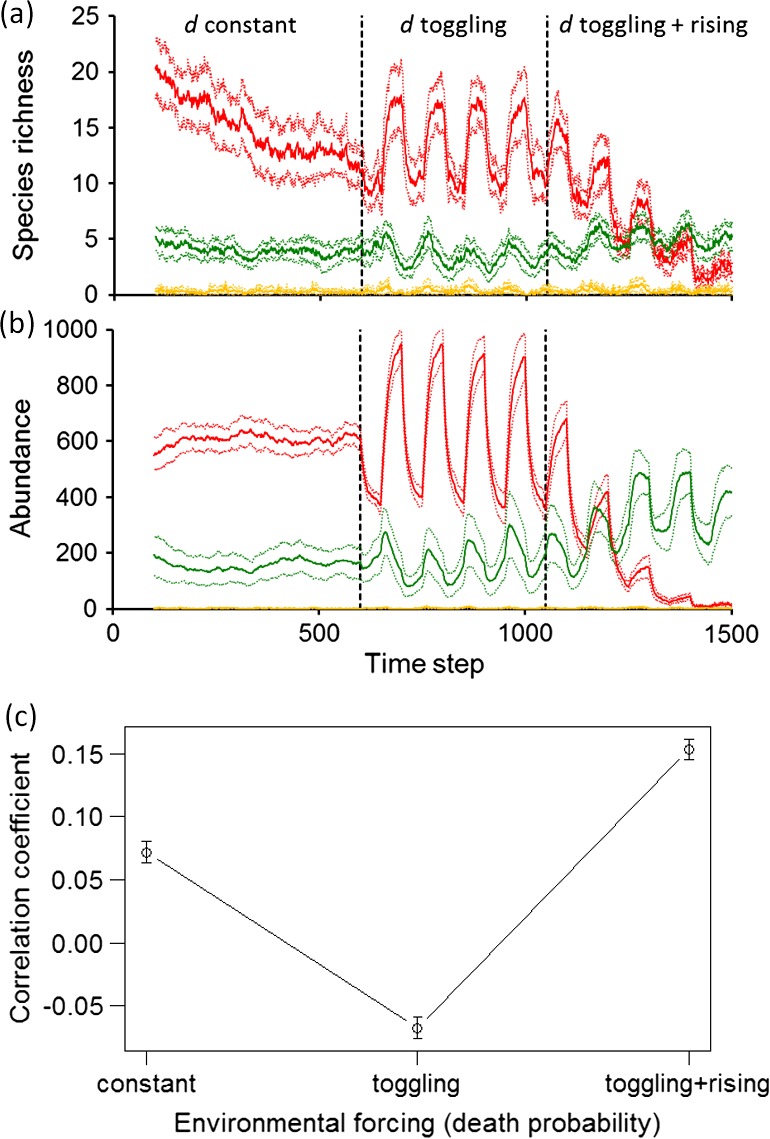
Figure 2.

Simulated community exposed to consecutive periods of environmental forcing. An initial period of agents having constant death probability d is followed by a period of toggling d around the same mean as for the initial period, followed by a period of toggling d around a rising mean. All responses are means ± 95% c.i., n = 15 replicate communities. (a) Number of species, and (b) numbers of individuals, of keystones (red, initially most numerous), weeds (green) and canaries (yellow, always rarest); (c) Product‐moment correlation of °disorder with Hill's diversity index N 2.
