
Figure 4.
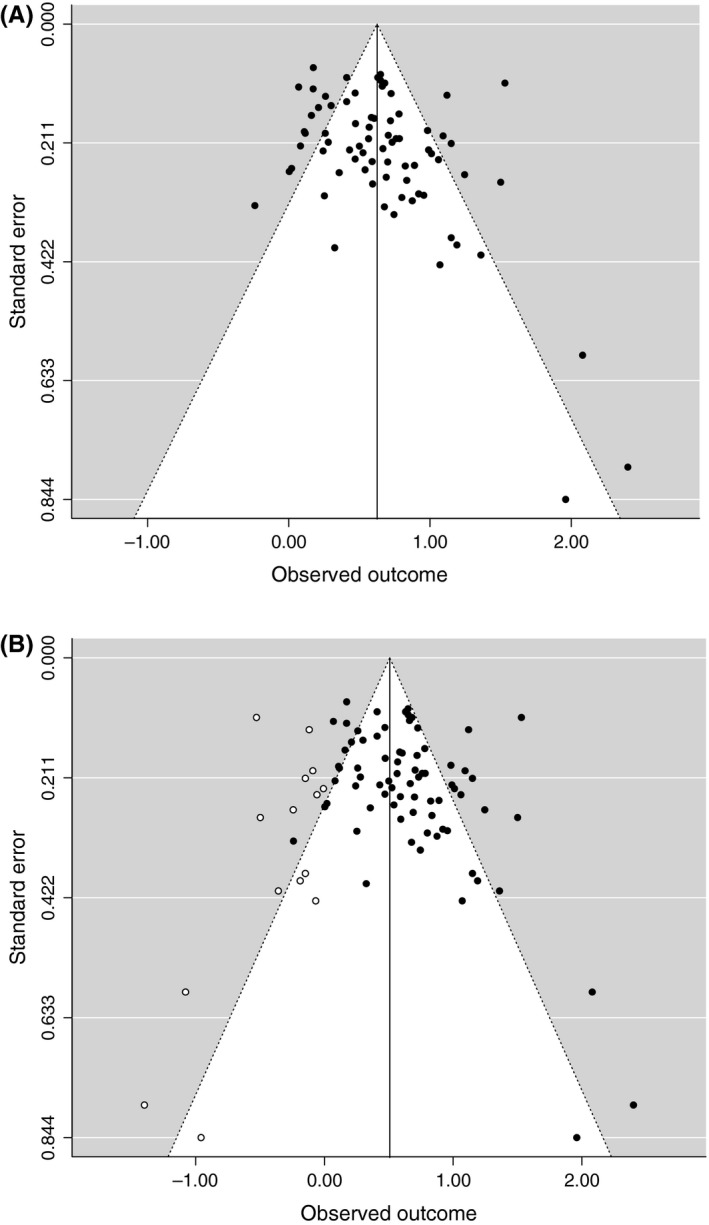
(A) Funnel plot for publication bias: Cohen's d to standard error. (B) funnel plot with trim and fill sensitivity test
Official websites use .gov
A
.gov website belongs to an official
government organization in the United States.
Secure .gov websites use HTTPS
A lock (
) or https:// means you've safely
connected to the .gov website. Share sensitive
information only on official, secure websites.
(A) Funnel plot for publication bias: Cohen's d to standard error. (B) funnel plot with trim and fill sensitivity test