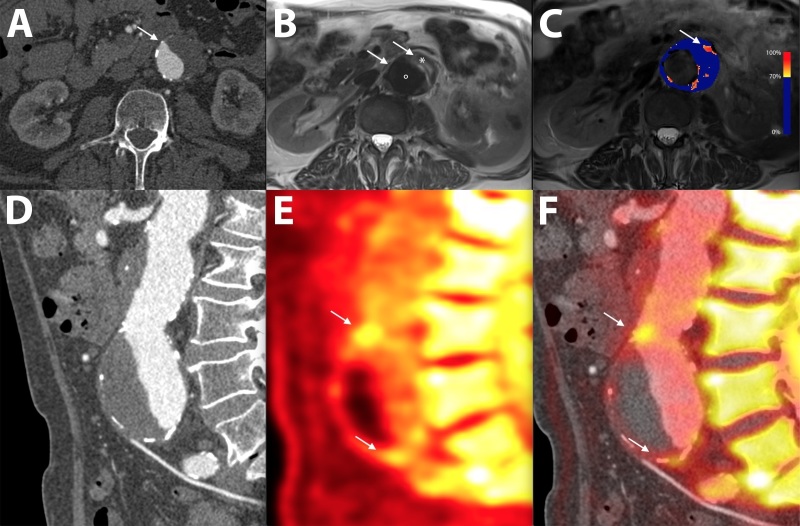
Figure 3.
CT, MRI and PET in a patient with a juxtarenal abdominal aortic aneurysm. (A) Transverse view of the aneurysm as seen on CT shows a dilated aorta with thrombus. (B) T2 weighted MRI of the same aorta differentiates between the lumen (•), thrombus (*) and adjacent structures. (C) A parametric map of the difference in T2* MRI intensity before and after the administration of ultrasmall particles of iron oxide uptake shows high focal uptake in the anterior wall of the aneurysm (arrow). (D) The sagittal CT view delineates the morphology of the aneurysm. (E) 18F-Sodium fluoride PET shows uptake within the anterior aortic wall (arrows) detects areas of greatest vascular injury. (F) Superimposing PET over the CT confirms high 18F-Sodium fluoride uptake at the aneurysm neck and near the bifurcation (arrows). PET,positron emission tomography

