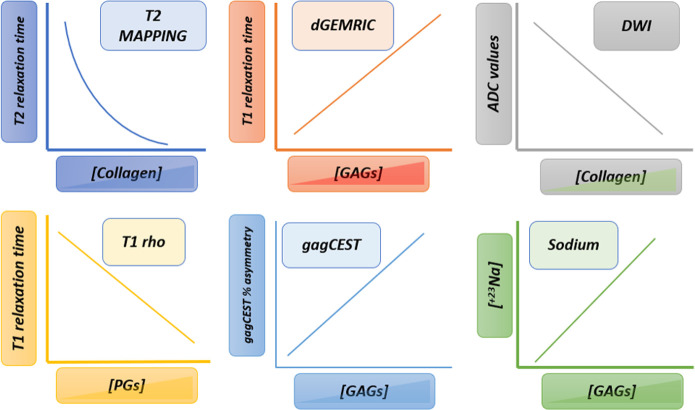
Figure 2. .
Summary techniques. Each functional technique is able to assess, in dominant manner, the integrity or depletion of a specific component of ECM. Thus, the relationship between collagen fiber concentration and T2 relaxation time is inverse, as well as the relationship between ADC values and collagen fibers. PGs and GAGs concentration have a positive correlation with the T1 relaxation times after gadolinium injection in dGEMRIC model as well as a positive lineal correlation with the percentage of gagCEST asymmetry and sodium concentration. T1 relaxation time in T1rho acquisition has inverse correlation with PGs concentration. ADC, apparent diffusion coefficient; dGEMRIC, delayedgadolinium enhanced MRI of cartilage; ECM, extracellular matrix; GAG, glycosaminoglycan; gagCEST, Chemical ExchangeSaturation Transfer imaging of GAG; PGs, proteoglycans.

