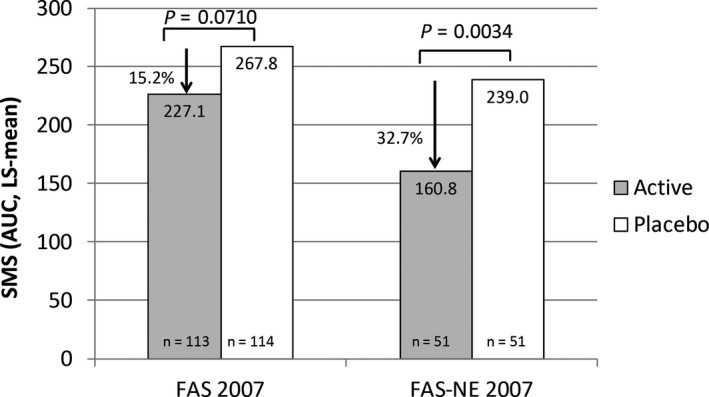
Figure 4.

Reduction in LS‐mean AUC of the SMS in the second year of therapy (2007): FAS and FAS‐NE. The figure shows the reduction in SMS of the active‐ vs placebo‐treated patients of the FAS and FAS‐NE subgroup in 2007 (primary endpoint). AUC, area under the curve; FAS, Full Analysis Set; FAS‐NE, FAS north‐east subgroup (patients of centres in Sweden, Finland and Poland, excluding the most south‐western centre in Poland); LS, least‐squares; n, number of patients; SMS, Symptom Medication Score
