
. 2019 Apr 17;39(3):205–215. doi: 10.1111/opo.12613
© 2019 The Authors. Ophthalmic and Physiological Optics published by John Wiley & Sons Ltd on behalf of College of Optometrists
This is an open access article under the terms of the http://creativecommons.org/licenses/by/4.0/ License, which permits use, distribution and reproduction in any medium, provided the original work is properly cited.
Figure 1.
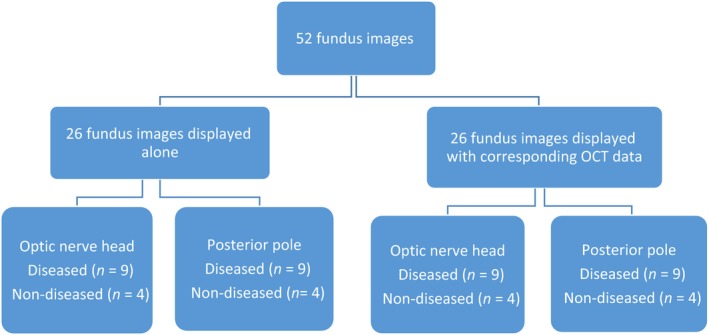
Flow diagram of the image allocation for the assessment.