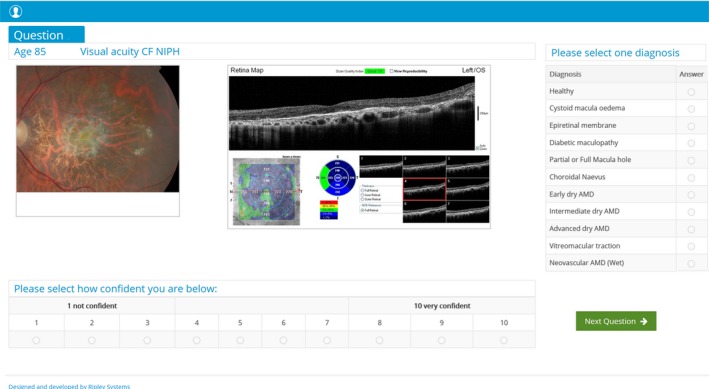
Figure 2.

Question illustrating the central retina with the corresponding optical coherence tomography (OCT) retinal map. OCT data included seven B‐scans displaying sections of the macula from superior to inferior; macular thickness map that is colour coded according to the machines normative database.
