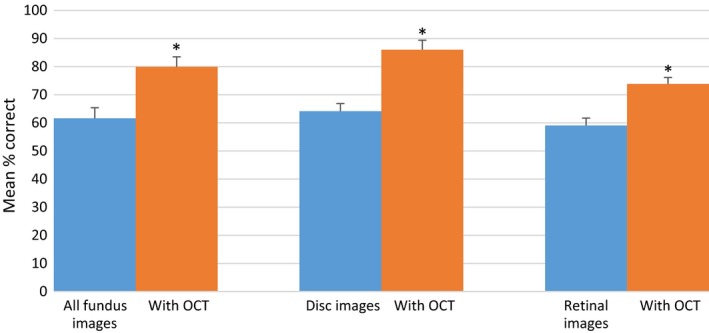
Figure 4.

Correctly identified mean percentage score of total, optic discs and retinal cases using fundus alone and combination optical coherence tomography (OCT). Error bars show 95% confidence intervals. * indicates a statistically significant difference (p < 0.001).
