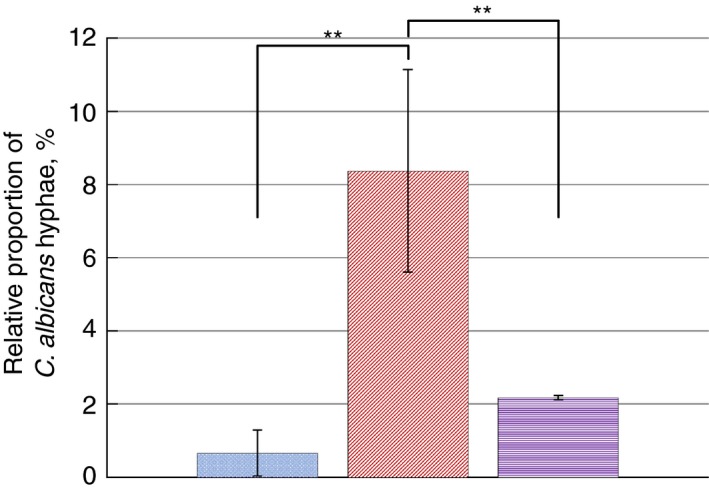
Figure 2.

Comparison of average number of Candida albicans hyphae, expressed as a percentage of the number of total cells (including yeast and hyphae) between C. albicans‐only biofilms (left‐most, blue dotted‐texture bar), mixed‐species biofilms (middle, red diagonal‐texture bar) and mixed‐species plus Porphyromonas gingivalis biofilms (right‐most, purple horizontal‐texture bar). A significant increase in the number of observed hyphae was evident in mixed‐species biofilms relative to C. albicans‐only and mixed‐species plus P. gingivalis biofilms. ( ) C. albicans only, (
 ) mixed‐species and (
 ) mixed‐species + P. gingivalis. [Colour figure can be viewed at http://wileyonlinelibrary.com]
