
Figure 2.
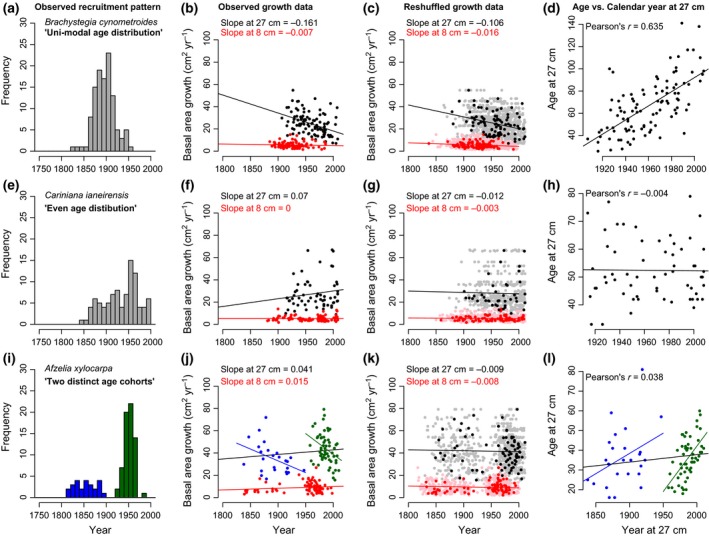
Examples of the effect of age distributions on growth trend observations in three selected species of van der Sleen. Left panels show the age or recruitment patterns, for Brachystegia with a unimodel age distribution, Cariniana with an even recruitment over time (resulting in a ‘logistic decline’‐type age distribution, cf. Vlam, 2014) and Afzelia with two distinct age cohorts (distinguished by blue and green colours). Panels in the second column show the resulting observed growth data and trends over time for two size classes (black points, at 27 cm; red points, at 8 cm in diameter). Panels in third column show the predicted trends due to underlying age distribution using the reshuffling approach (see main text). Panels on the right show the relation between calendar year and age when reaching the sample size of 27 cm. Unimodal age distributions, such as in Brachystegia (upper panels), lead in theory to negative growth trends, which are both observed and replicated using the shuffling approach. Such underlying recruitment patterns also result in a close relationship between age and calendar year at sampling size, and strong indication that growth data could be biased.