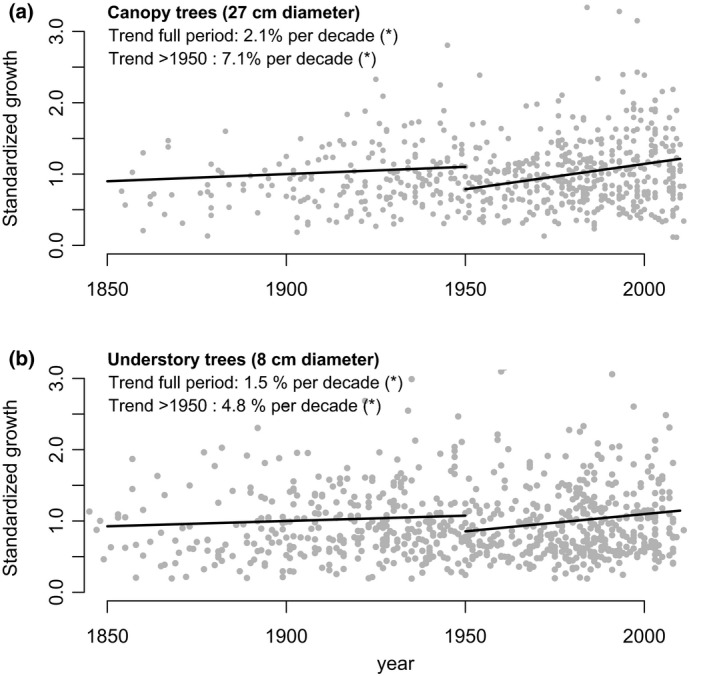
Figure 4.

Predicted growth trends after removal of the uneven age bias from the aggregated data set. Panels show trends for the full time period and the most recent period (>1950) for canopy trees (a) and understory trees (b). Shown are standardized growth data, allowing presentation of growth rates for all nine species in one single graph. Aggregated trends are estimated using linear mixed‐effects models from the lme package in r, see Pinheiro et al. (2015) with a variance structure as detailed in the Text S1. Note that these trends include only those nine species that are not biased by mortality biases.
