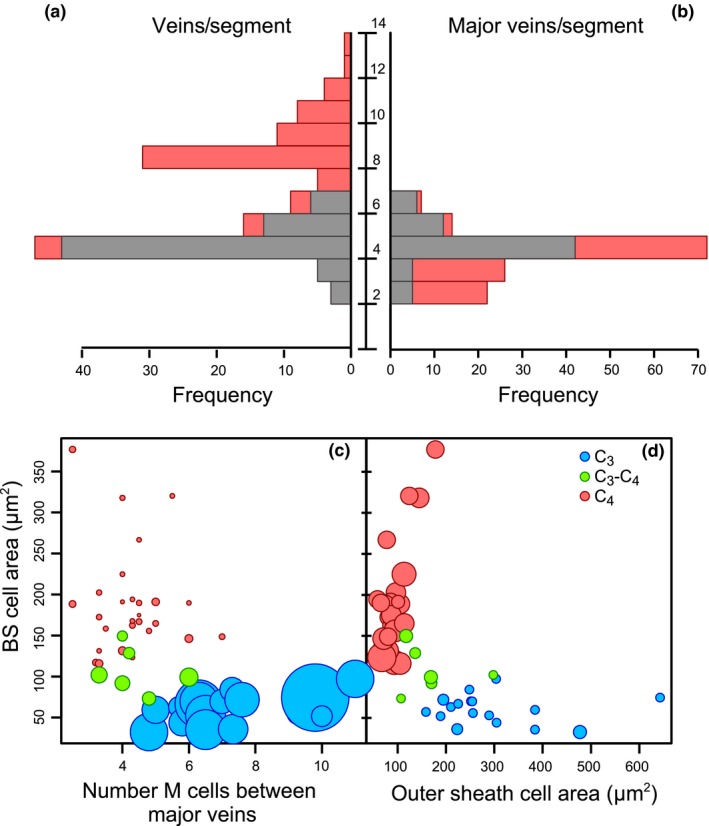
Figure 4.

Diversity of intraspecific anatomical components. Histograms of (a) vein density (i.e., the total number of veins per segment) and (b) the number of major veins per segment in C4 (red; n = 72) and non‐C4 (grey, n = 69) accessions. Scatter plots show (c) the average number of mesophyll (M) cells between major veins vs. the average area of individual bundle sheath (BS) cells, with dot size proportional to the M:BS ratio, and (d) BS cell area vs. outer sheath cell area, with dot size proportional to the number of veins per segment. Colours indicate photosynthetic type with C3 (blue; n = 17), C3‐C4 (green; n = 6) and C4 (red; n = 27).
