Figure 6.

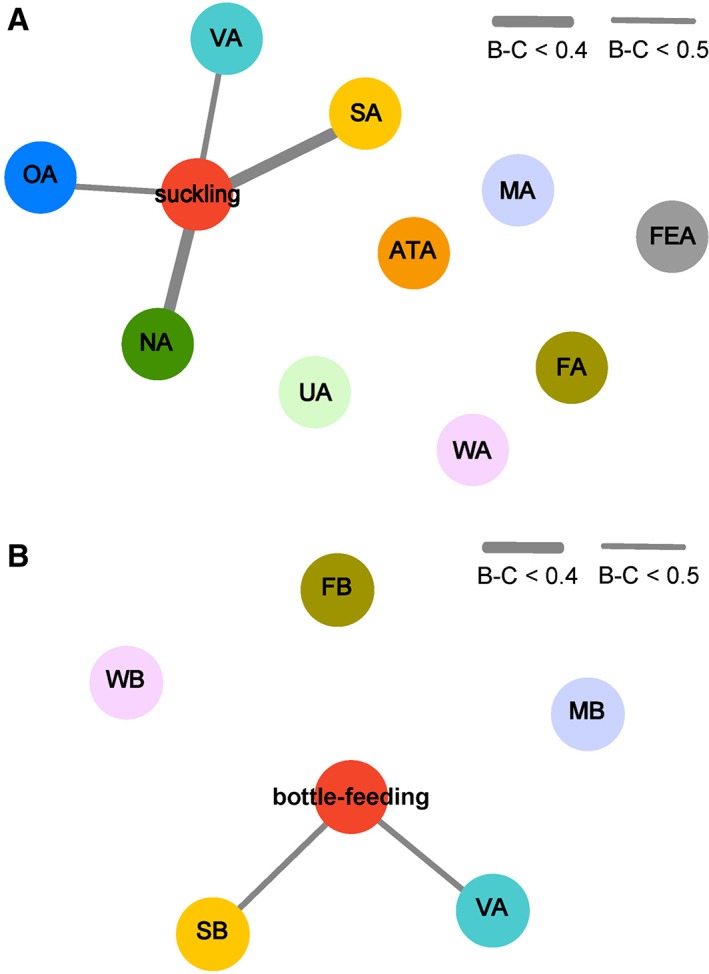
Similarity analysis of the bacterial communities in the gut of suckled (n = 6) and bottle‐fed (n = 6) lambs and the source environments. Bray‐Curtis (B‐C) dissimilarity was calculated using OTU‐level abundance of bacteria from the lamb gut, and maternal and environmental niches in this study. The different coloured circles represent bacterial communities of the gut and source environments. The thicker the connecting line and the closer the circles, the greater the similarity of the bacterial communities. (A) Similarity analysis of the bacterial communities in the gut of suckled lambs and the source environments. VA: maternal vagina; OA: maternal oral cavity; MA: milk from birth mother; FEA: maternal stool; NA: maternal teat skin; ATA: maternal abdominal region skin; UA: maternal udder skin; FA: sheep pen floor of suckled group; WA: pen wall of suckled group; SA: ambient air of suckled group. (B) Similarity analysis of the bacterial communities in the gut of bottle‐fed lambs and the source environments. MB: milk for bottle feeding; FB: sheep pen floor of bottle‐fed group; WB: pen wall of bottle‐fed group; SB: ambient air of bottle‐fed group. Except for the MB, SA, and SB, the sample size of each maternal and environmental niche was 6. The sample size of MB was 3. The ambient air microbes of each group were sampled using the same gelatin membrane filter for three consecutive days, so both SA and SB had a sample size of 1. [Color figure can be viewed at http://wileyonlinelibrary.com]
