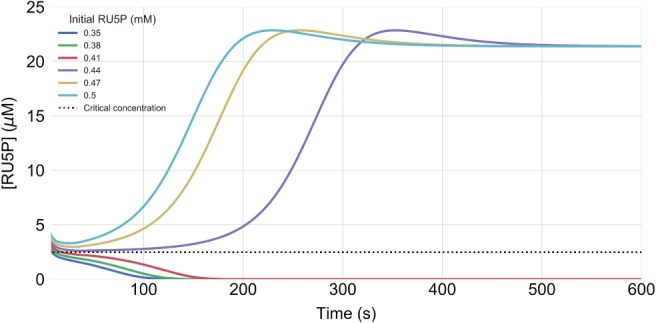
Figure 3.

Simulations in light intensity of 500 μmol m−2 s−1 for different initial concentrations of Ru5P, ranging from 0.35 to 0.5 mM. The Ru5P abundance is shown after 10 s, when the system is approximately equilibrated. The dashed line displays the critical concentration for sufficient cyclic activity after equilibrating. The figure displays that initial Ru5P concentrations below 0.44 mM result in a loss of Ru5P abundance.
