Figure 4.

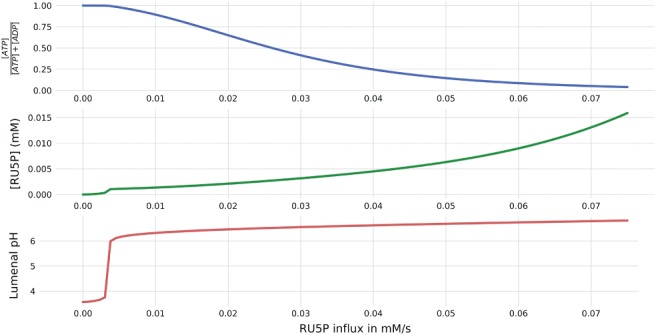
Steady state simulations in low light intensity of 5 μmol m−2 s−1 and systematically increasing influxes of Ru5P from 0 to 0.08 mM s−1. The figure displays normalized ATP abundance, Ru5P concentration and lumenal pH.

Steady state simulations in low light intensity of 5 μmol m−2 s−1 and systematically increasing influxes of Ru5P from 0 to 0.08 mM s−1. The figure displays normalized ATP abundance, Ru5P concentration and lumenal pH.