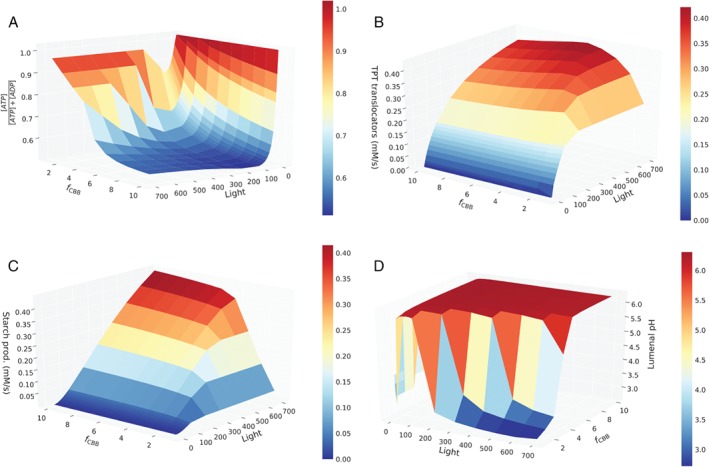
Figure 5.

Steady state analysis of the merged photosynthesis model under varying light intensities (x‐axis) and carbon fixation velocities (y‐axis). On the z‐axis (A) the relative ATP abundance, (B) TPT export flux, (C) starch production rate and (D) lumenal pH are displayed.
