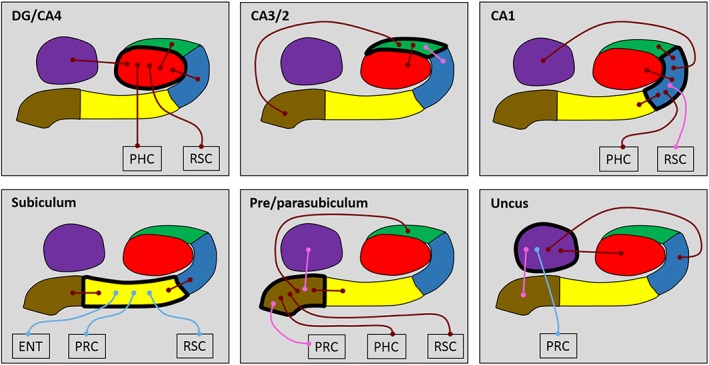
Figure 2.

Results of the whole subfield analyses for the young and older participant groups. The relevant subfield in each panel is outlined in a thick black line. The thin lines with circular termini represent significant correlations of activity with the activity in other hippocampal subfields and/or extra‐hippocampal ROIs. Dark red lines represent significant correlations common to both young and old groups. Light blue lines represent significant correlations present only in the young group. Pink lines represent significant correlations present only in the older group. DG/CA4 (red), CA3/2 (green), CA1 (blue), subiculum (yellow), pre/parasubiculum (brown), uncus (purple); ENT, entorhinal cortex; PHC, posterior parahippocampal cortex; PRC, perirhinal cortex; RSC, retrosplenial cortex [Color figure can be viewed at http://wileyonlinelibrary.com]
