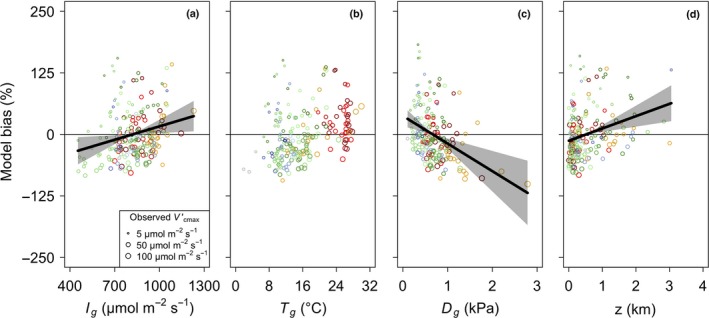
Figure 3.

Partial residuals of the observed bias (%) in maximum rate of Rubisco carboxylation () predicted by the theoretical model at each of the 201 sites plotted against growing season light (I g), growing season temperature (T g), growing season leaf‐to‐air vapour pressure deficit (D g), and elevation (z) (grey circles). Model bias was defined as , where is the predicted optimal and is the observed . Data points are sized logarithmically by . Lines indicate the modelled response from the multiple linear regression models. Shading indicates 95% confidence intervals for regression lines. Only significant trends (P < 0.05) are shown. Colours are as in Figure 2.
