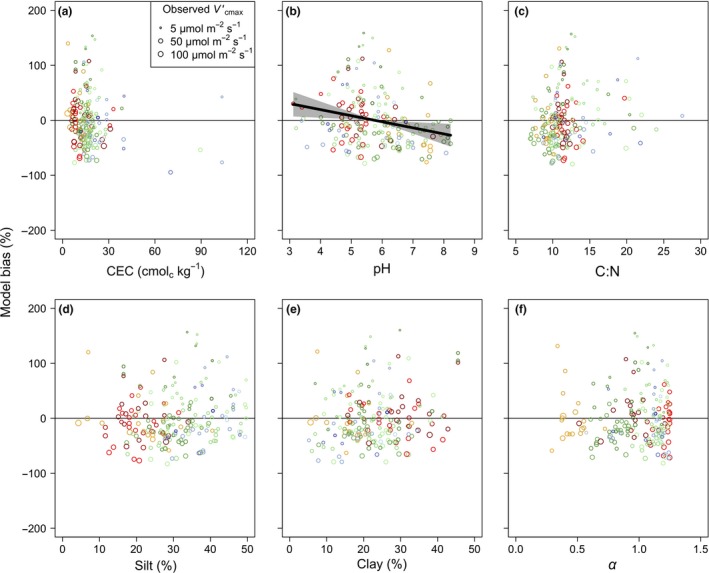
Figure 5.

Model bias in relation to soil variables. Partial residuals of the observed bias (%) in the maximum rate of Rubisco carboxylation predicted by the theoretical model () by site plotted against soil cation exchange capacity (CEC, panel a), pH (panel b), carbon‐to‐nitrogen ratio (C:N, panel c), silt content (panel d), clay content (panel e), and an index of soil water availability (α; panel f) (black transparent circles). Model bias was defined as , where is the predicted optimal and is the observed . Data points are sized logarithmically by . Lines indicate the modelled response from the multiple linear regression models. Shading indicates 95% confidence intervals for regression lines. Only significant trends (P < 0.05) are shown. Data are plotted for each of the 193 sites that had available soil data. Colours are as in Figure 2.
