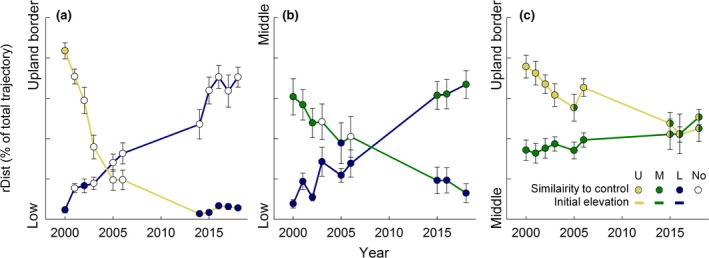
Figure 3.

The degree of convergence between initial and target vegetation as the relative distance to control vegetation for the pair that moved between (a) upland border and low elevation, (b) middle and low elevation and (c) upland border and low elevation. Note that the y‐axis of the different panels differ. Values on the y‐axis are the relative distance of the treatment turfs to the control centroids indicated on the axis (20% increments per thick mark). Each dot is the mean of eight replicates, and the filling indicates if the NMDS scores of the turfs were significantly (in)different to one or both control turfs
