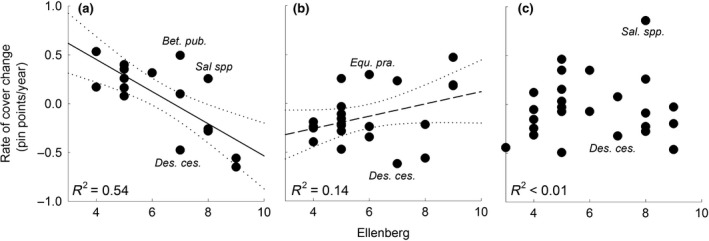
Figure 5.

Rate of cover change per species in treatments where turfs were moved towards (a) higher and (b) lower elevations and (c) remained at their own elevation in relation to their Ellenberg value for moisture. Each point is the mean of one species in three treatments. Indicators of succession are indicated with abbreviated species names (Betula pubescens, Deschampsia cespitosa, Equisetum pratense or Salix spp, which were assigned the Ellenberg value of the common Salix phylicifolia). Lines indicate regression lines and their 95% confidence interval
