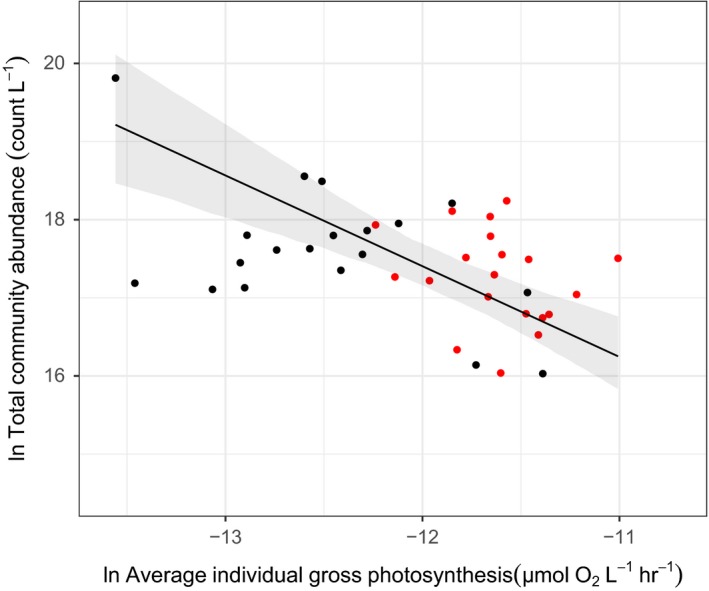
Figure 4.

Total community abundance decreases as average individual gross photosynthesis increases. Average individual gross photosynthesis was calculated from the values of the maximum likelihood approach for gross primary productivity (see Methods). Consistent with zero sum dynamics, increases in average individual gross photosynthesis resulted in a compensatory decrease in total community abundance. The exponent, fitted using standardised major axis regression on log‐transformed data, is −1.16, which is not significantly different from the predicted value of −1. Warm mesocosms (red) have higher average individual metabolic rates than ambient mesocosm communities (black) because of being dominated by larger individuals. Each point represents a community, the solid line is the predicted fit of the SMA regression and the shaded region are 95% confidence intervals.
