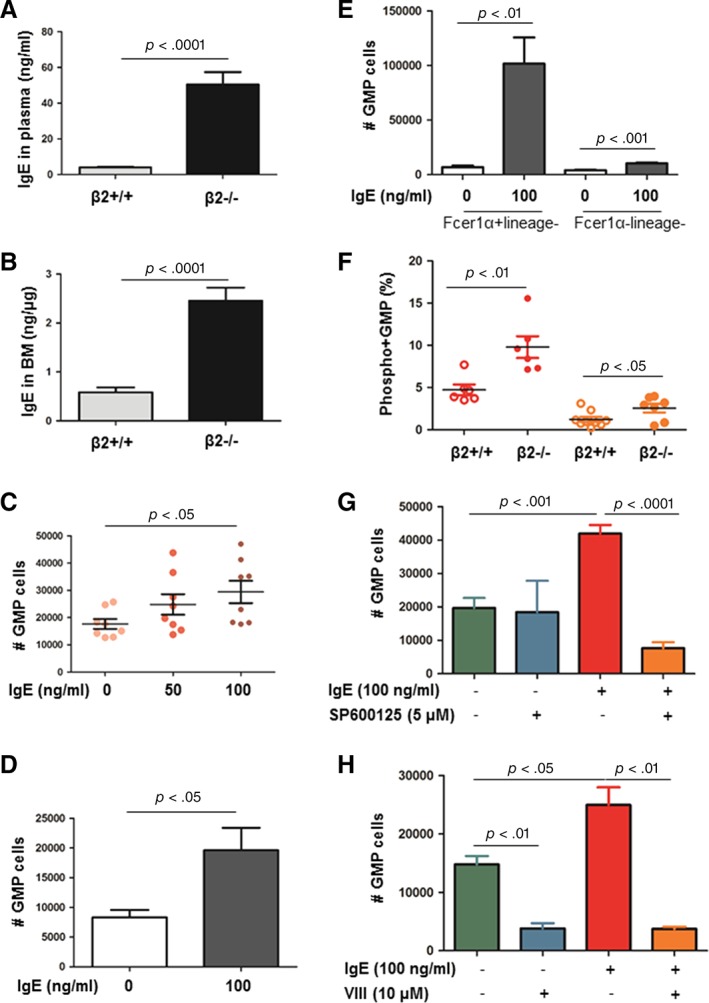
Figure 5.

FcεRIα/IgE‐induced GMP proliferation via JNK phosphorylation. (A, B): The levels of IgE in plasma and bone marrow detected by ELISA. n = 9–14. (C–E): Lineage−/low cells (C), FACS‐sorted GMP (D), and FACS‐sorted FcεRIαhilineage− cells and FcεRIα−lineage− cells (E) were cultivated in vitro in the presence of IgE (0–100 ng/ml) for 5 days. Cells were harvested, numerated, and stained with GMP surface markers for FACS analysis. GMP number was computed by GMP proportion multiplied by cell number. n = 4–8. (F): Freshly isolated β2+/+ and β2−/− bone marrow cells were permeabilized and stained with anti‐phosphoAkt (or phosphor‐JNK) together with surface markers for GMP. pAkt+ GMP and pJNK+ GMP were quantified by FACS. n = 6–8. (G, H): Lineage−/low cells were cultivated with IgE in the presence or absence of pAkt inhibitor VIII (10 μM) or pJNK inhibitor SP600125 (5 μM). GMP number after cultivation was assessed as described above. n = 4–5. Abbreviations: BM, bone marrow; FACS, fluorescence activated cell sorting; GMP, granulocyte/macrophage progenitor.
