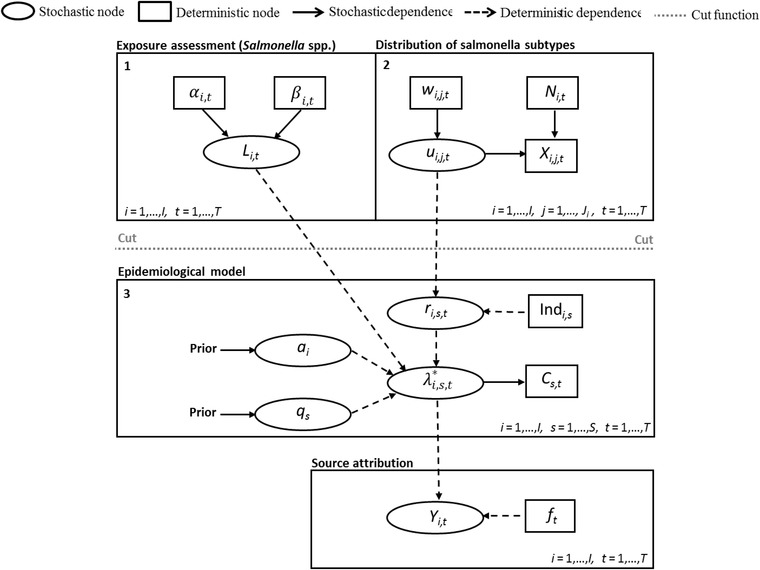
Figure 1.

A directed acyclic graph of the modular Bayesian source attribution model. The full Bayesian model was separated into three modules using a cut function (provided in OpenBUGS software).

A directed acyclic graph of the modular Bayesian source attribution model. The full Bayesian model was separated into three modules using a cut function (provided in OpenBUGS software).