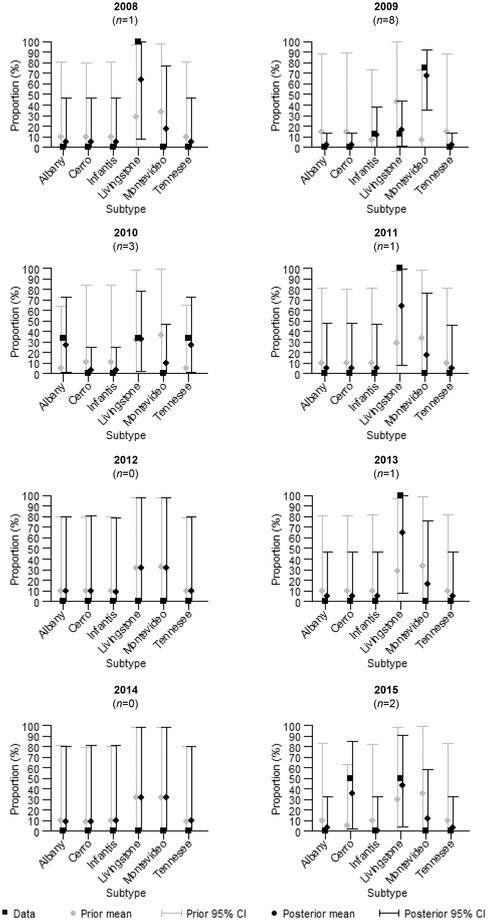
Figure 2.

The annual percentages of different subtypes detected from domestic chicken meat (data) and the sample‐based prior, as well as the posterior mean and 95% credible interval for the proportion of different salmonella subtypes in domestic chicken meat ({u 1}). The annual sample sizes (number of positives) are denoted with n.
