Figure 3.

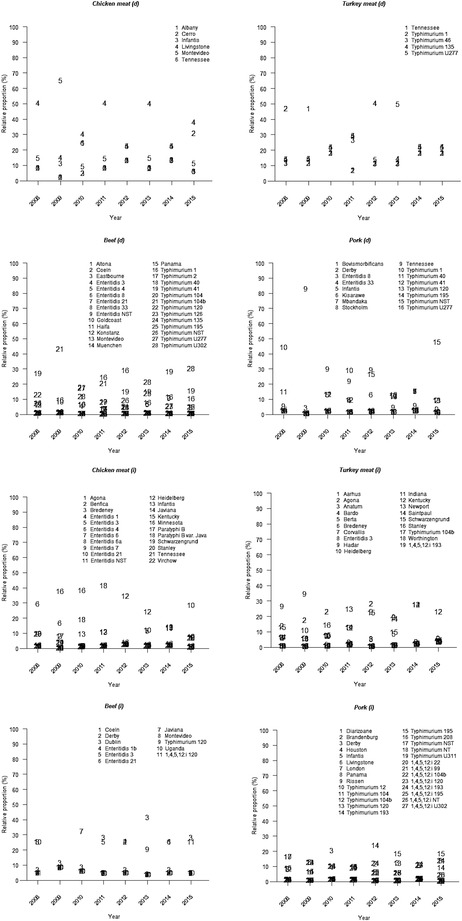
The posterior mean for the annual proportion of different salmonella subtypes in each of the sources ({ui.t}). Domestic sources are denoted with d and imported sources with i.

The posterior mean for the annual proportion of different salmonella subtypes in each of the sources ({ui.t}). Domestic sources are denoted with d and imported sources with i.