Figure 5.

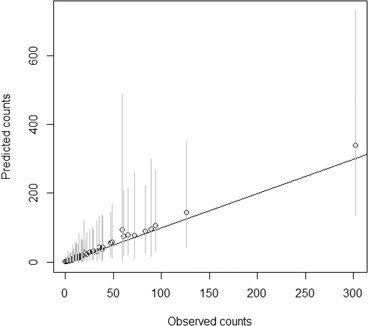
Predicted (posterior mean) versus observed number of cases for salmonella subtypes. Cases summed over years are represented by dots, and 95% credible intervals for the predicted cases are shown in the vertical gray lines.

Predicted (posterior mean) versus observed number of cases for salmonella subtypes. Cases summed over years are represented by dots, and 95% credible intervals for the predicted cases are shown in the vertical gray lines.