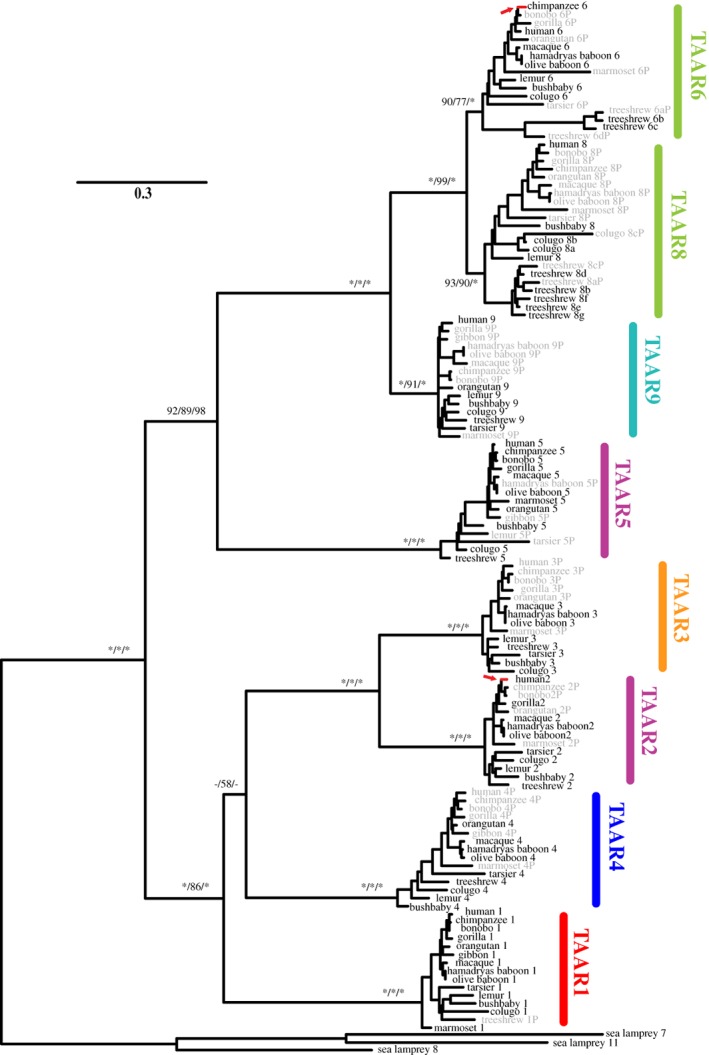
Figure 1.

Evolutionary relationship among the TAAR subfamilies from 13 primates, the Malayan colugo, and the northern treeshrew. The phylogenetic tree is reconstructed using the maximum‐likelihood method. All TAAR7 pseudogenes were excluded from the analysis. Three sea lamprey TAAR‐like proteins were used as outgroups. The numbers for the internal branches show the bootstrap support values (%) for the neighbor‐joining and maximum‐likelihood phylogenies and the posterior probability (%) for the Bayesian phylogeny in this order, with asterisks indicating scores of 100%. Supporting values are shown only for the major internal branches. Gray names indicate pseudogenes. The two red‐colored branches and arrows indicate those that were identified to be subject to positive selection by PAML branch‐site models (see Table S5). The TAAR subfamily names are shown in different colors based on their taxonomic distribution as follows: TAAR1 found in jawed vertebrates in red, tetrapod‐specific TAAR4 in dark blue, amniote‐specific TAAR2 and TAAR5 in purple, mammalian‐specific TAAR3 in orange, therian‐specific TAAR9 in cyan and eutherian‐specific TAAR6 and TAAR8 in light green
