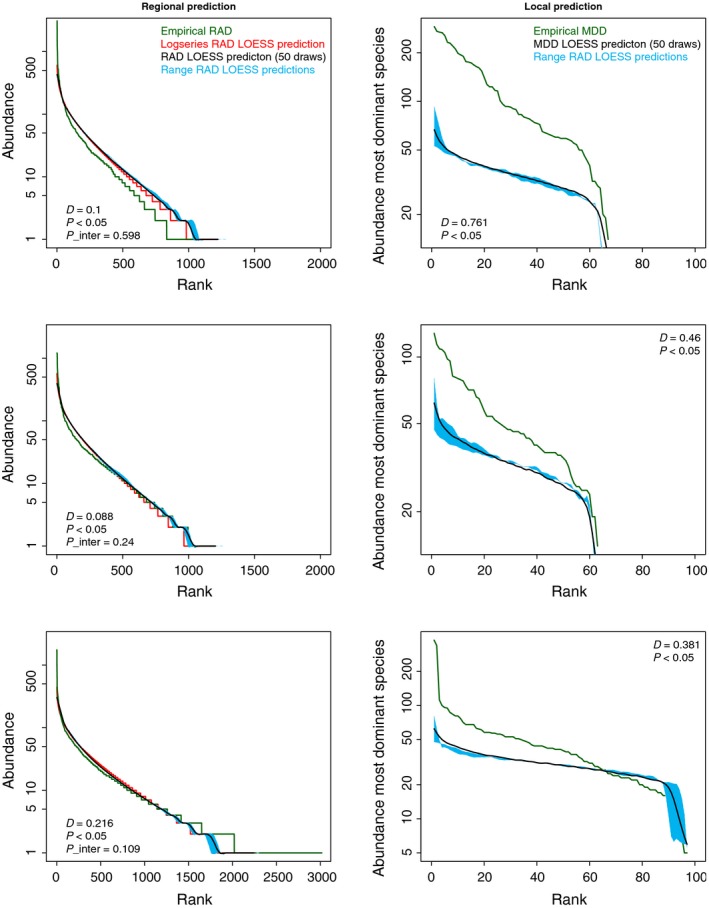
Figure 1.

The rank abundance distribution (RAD, left) and maximum dominance distributions (MDD, right) for tree species in 223 Amazon forest plots from Guyana/Suriname (top), French Guiana (middle) and Ecuador/Peru (bottom). Lines indicate empirical (green) and simulated data (black) or fitted logseries (red). Blue shading indicates upper and lower RAD or MDD based on 50 sampling iterations of the total simulated forest. For the RADs, x‐axis indicates the rank from most abundant to least abundant species, with y‐axis showing actual abundances of the species for the ith rank. For the MDDs, x‐axis reflects ranking of plots and y‐axis the maximum dominance of the most abundant species for each plot. D, P and P_inter values represent maximum distance and significance values derived from the Kolmogorov–Smirnov tests with P_inter the comparison between the truncated RADs (ranks 50–750).
