
Figure 2.
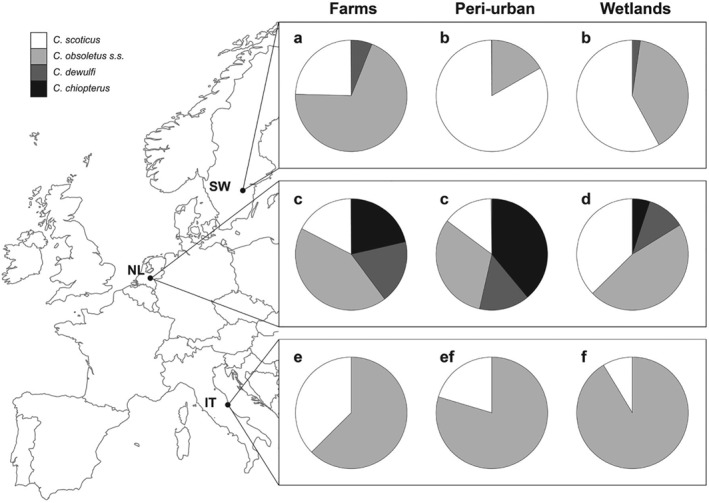
Within‐effect of habitat in each of the three countries (rows) on the ratio of the four species in the Obsoletus group, and within‐effect of country in each habitat type (columns). The sample size for each pie chart ranges from 6 to 99 (see also Table 1). Letters display significant differences among ratios shown in rows and columns at a significance level of P < 0.05. SW, Sweden, NL, The Netherlands, and IT, Italy.