
Figure 2.
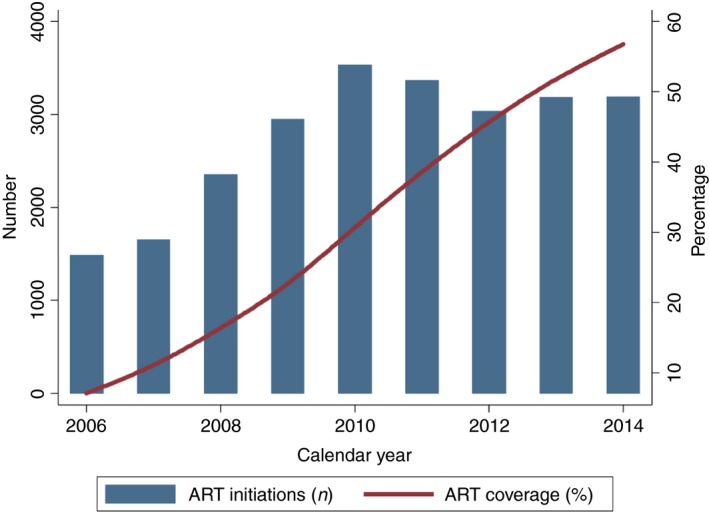
Annual number of ART initiations and treatment coverage during ART programme expansion (2014–2016). ART, antiretroviral therapy; n, number. [Colour figure can be viewed at http://www.wileyonlinelibrary.com/]
Official websites use .gov
A
.gov website belongs to an official
government organization in the United States.
Secure .gov websites use HTTPS
A lock (
) or https:// means you've safely
connected to the .gov website. Share sensitive
information only on official, secure websites.
Annual number of ART initiations and treatment coverage during ART programme expansion (2014–2016). ART, antiretroviral therapy; n, number. [Colour figure can be viewed at http://www.wileyonlinelibrary.com/]