
Figure 1.
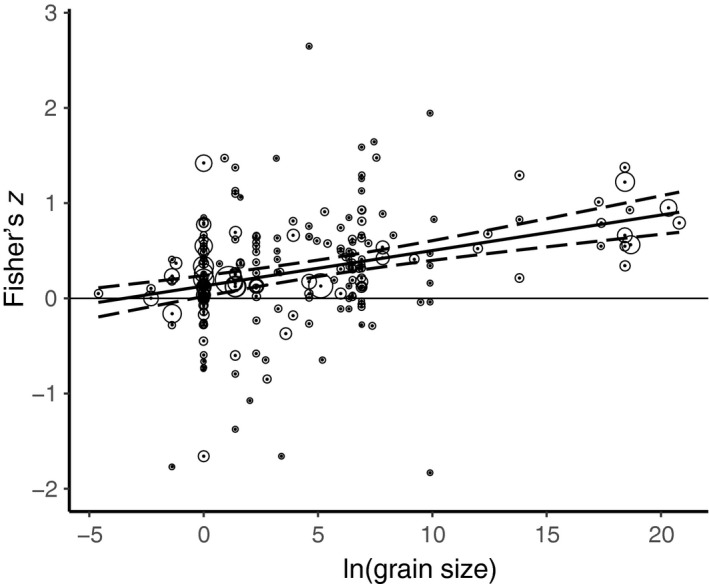
The relationship between Fisher's z (native–exotic richness relationship) and the natural log of grain size (m2) showing the calculated hierarchical mixed‐effects meta‐regression slope (solid line) and 95% confidence intervals (dashed lines). Open circles around points have radii relative to the inverse variance of each case, i.e., studies with larger circles have lower variance in z.