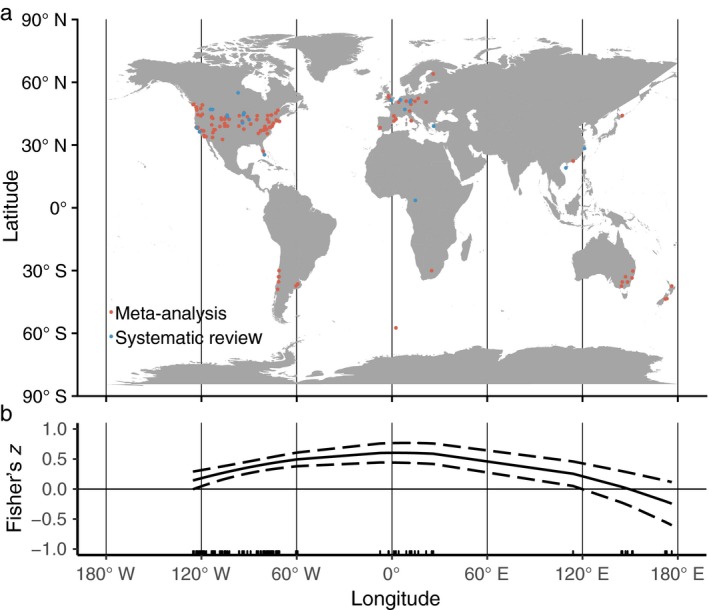
Figure 4.

(a) The locations of cases, expressed as latitude and longitude midpoints. Red points represent cases included in both the meta‐analysis and systematic review databases; blue points represent locations of cases only included in the systematic review database. (b) Mixed‐effects meta‐regression of Fisher's z (relationship of NERR and grain) as a function of longitude including linear and quadratic terms with a 95% confidence interval. A frequency rug is shown on the x‐axis. [Color figure can be viewed at http://www.wileyonlinelibrary.com]
