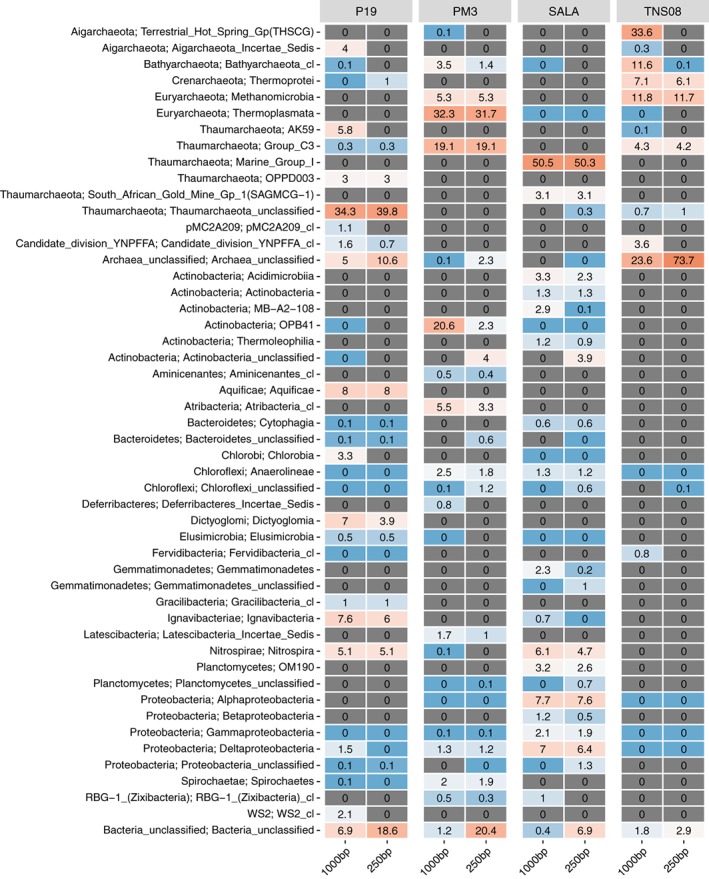
Figure 2.

Relative abundance (%) estimates of environmental samples based on qtrim ccs reads. Top 50 most abundant lineages (phylum; class) across the four samples are shown. Colours in a blue‐to‐red gradient reflect low‐to‐high relative abundances. Unobserved lineages are indicated with grey.
