Figure 4.

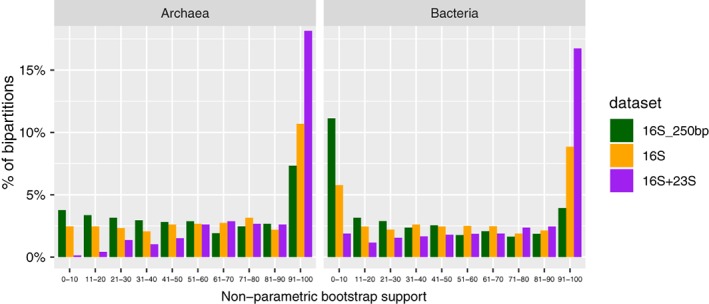
Non‐parametric bootstrap support distributions in maximum likelihood phylogenies of ‘16S_250bp’, ‘16S’ and ‘16S + 23S’ data sets (see Methods ‐ Phylogenetic analyses). Separate comparisons for Archaea and bacteria data sets are shown.

Non‐parametric bootstrap support distributions in maximum likelihood phylogenies of ‘16S_250bp’, ‘16S’ and ‘16S + 23S’ data sets (see Methods ‐ Phylogenetic analyses). Separate comparisons for Archaea and bacteria data sets are shown.